Visualizing Xcode's View Debugger
Wednesday, Jul 24, 2019
A couple days ago I noticed a really weird bug, images that had been used as templates would occasionally draw darker or lighter (rather than the color originally chosen). I thought it was just some weird duplicate layer ontop of another layer that would lead to the icon being darker / lighter.
I tried using Xcode's View Debugger, but it just wouldn't work at all and would error out with:
Assertion failed: ([layer isKindOfClass:[self class]]), function -[CALayer _initWithReference:], file /BuildRoot/Library/Caches/com.apple.xbs/Sources/QuartzCore/QuartzCore-697.24.4.2/LayerKit/api/CALayer.mm, line 1947.
Somehow we had a CALayer which… wasn't a CALayer? Seeing as though Mojave has been having some super broken CALayer stuff recently, I assumed it might've been a similar issue. Perhaps having too many layers was also corrupting the rendering of images?
It turns out, the original bug in question is actually an AppKit bug, but this bug lead me down a path of understanding how Xcode's View Debugger works.
Debugging a… Debugger
I figured I could just put a breakpoint on -[CALayer initWithReference:], but sadly that breakpoint was never hit. There were potentially a few reasons from this:
- There's some out of process that handles Xcode's View Debugger.
- This
-[CALayer initWithReference:]is being invoked inside Xcode's process. - LLDB breakpoints don't work with Xcode's View Debugger.
Cutting this writeup short, there's no XPC process we need to worry about (thankfully), and manually attaching LLDB to Xcode and trying to break on that function didn't work either. Turns out, LLDB doesn't work when you're trying to set a breakpoint during Xcode's loading of the View Debugger, so we need to get a bit more creative…
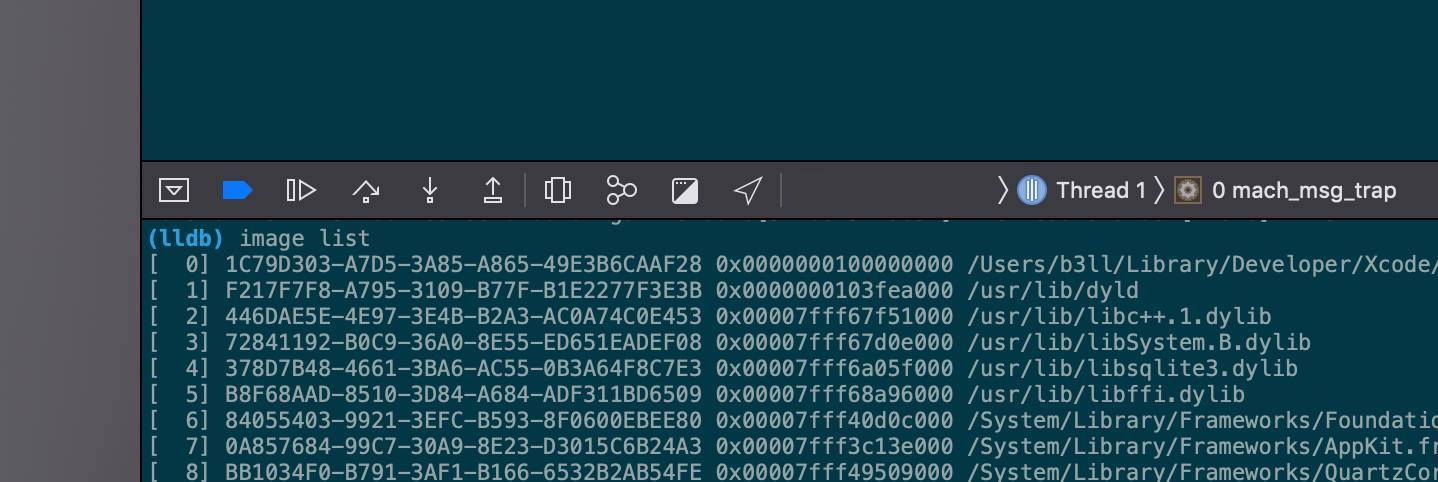
After starting the View Debugger, we can use image list to print out all the currently loaded libraries into the app being debugged:
(lldb) image list
...
[  1] F217F7F8-A795-3109-B77F-B1E2277F3E3B 0x0000000103fea000 /usr/lib/dyld
...
[298] BD43F13C-7F88-301D-A860-77EE5F6CBBE4 0x00000001042bc000 /Applications/Xcode.app/Contents/Developer/Platforms/MacOSX.platform/Developer/Library/Debugger/libViewDebuggerSupport.dylib
...
libViewDebuggerSupport.dylib looks interesting.
It turns out, Xcode will dynamically inject that dylib into the running application and call some special methods on it in order to get info on how the application's view hierarchy works. This is very similar to how Reveal works (albeit sadly that app doesn't work for debugging AppKit apps…).
Finding Callsites
Now that we know what binary is being loaded, we need to find out how it's actually starting this view debugging code. We can use static analysis and decompilation to figure this out.
Hopper is a fantastic tool for taking apart binaries, and it's something I always find myself coming back to. The way it works? Simply hand it an executable, and it will disassemble the executable, showing the innerworkings of what it does.
Opening that dylib up into Hopper, and searching for "viewdebugger" will give us lots of results for methods on the class DBGViewDebuggerSupport. Trawling through those results we'll eventually find [DBGViewDebuggerSupport fetchViewHierarchy]. Now this seems to be the main-ish method that's called to kickstart things, so we'll see what it does. We're trying to find where the layers are referenced so we'll see what happens with the sublayer hierarchies. Eventually we'll see something like
var_170 = [r14 _collectSubviewInfoForView:r13 encodeLayers:rcx];
This is shown in the decompiled code, $r14 and $r13 are registers in the CPU, which hold references to objects (kinda). Navigating inside that method, we'll eventually find the magic function that we seem to be breaking: CAEncodeLayerTree(CALayer *layer) which is inside QuartzCore.framework.
Calling Private Functions
Now, whilst it'd be easy to just invoke that function from LLDB, our breakpoint still won't be hit (since you can't break on things being invoked from LLDB), so we need to hardcode a way of invoking it. CAEncodeLayerTree also is private API, and has no header definition, so we'll need to use something else… something like dlopen and dlsym should help! dlopen will open / load a library into the current process and return a pointer to the address where it starts in memory, and dlsym will lookup the pointer to the function itself so we can manually call it:
#import <dlfcn.h>

void *quartzCore = dlopen("/System/Library/Frameworks/QuartzCore.framework/QuartzCore", RTLD_NOW|RTLD_GLOBAL);
void(* CAEncodeLayerTree)(CALayer *) = (void (*)(CALayer *))dlsym(quartzCore, "CAEncodeLayerTree");
CAEncodeLayerTree(view.layer);
I assigned this to a double click, but you can invoke it however you like.
Finally, to figure out the weird layer that's breaking things, we can use LLDB's conditional breakpoints:
(lldb) b -[CALayer _initWithReference:]
Breakpoint 5: where = QuartzCore`-[CALayer _initWithReference:], address = 0x00007fff496ba037
(lldb) breakpoint set --name "-[CALayer _initWithReference:]" --condition '([$arg3 isKindOfClass:[$arg1 class]] == 0)'
Here we're setting a conditional breakpoint on -[CALayer _initWithReference:] emulating the assert that was failing previously. Here, $arg3 is the argument passed to -initWithReference: and $arg1 is the object the method is being invoked on (aka self when you've hit the breakpoint). This is using aliases for registers that'd be used when calling Objective-C methods. For more details on how these "pseudo" registers work, check out @natashatherobot's post, and if you're super interested, this post goes into lots of details.
Finally, invoking this will allow us to finally find our view that's breaking things. Once the breakpoint is hit, we can just invoke po $arg3 to see what object is breaking things.
Closing Notes
In my case, I was incorrectly configuring a CAGradientLayer's delegate incorrectly. Fixing that resolved the issue.
Sometimes the best approach to fixing bugs is to, well, debug a debugger. It's pretty dense, and reverse engineering opaque technologies isn't talked about that much nowadays, so I figured I'd post more broadly about how I go about researching / investigating the internals of various things.
Hope you found this post helpful and If you've got any questions, feel free to message me!
PS: @indragie made an amazing open source project that aims to replicate Xcode's View Debugger / Reveal and it's pretty awesome. Check it out here!